Score History
Score History provides a visual timeline of how a lead's engagement score has changed over time. This feature helps you understand engagement trends, identify patterns, and make informed decisions about when to reach out to leads.
Understanding Score History
Every lead in kenbun has a score that changes as they engage with your content, open emails, visit your website, and take other actions. Score History tracks these changes over time, giving you insights into:
- Engagement Trends: Is this lead becoming more or less engaged?
- Peak Activity: When did this lead show the most interest?
- Decay Patterns: Are long periods of inactivity reducing the score?
- Campaign Impact: Did your marketing campaign boost engagement?
How Score Tracking Works
Automatic Score Snapshots
kenbun automatically captures score snapshots for all leads:
- Frequency: Scores are snapshotted once per hour
- Retention: Score history is retained for 90 days by default
- No Action Required: Tracking happens automatically in the background
- Historical Data: View trends from the moment snapshots began
What Gets Tracked
For each snapshot, kenbun records:
- Score: The total engagement score at that moment
- Timestamp: When the snapshot was taken
- Ruleset (optional): Which scoring ruleset the score came from
This data is then used to generate visual charts and trend indicators.
Viewing Score History
On Lead Detail Pages
Score history is displayed on each lead's detail page:
- Navigate to Leads
- Click on any lead to open their detail page
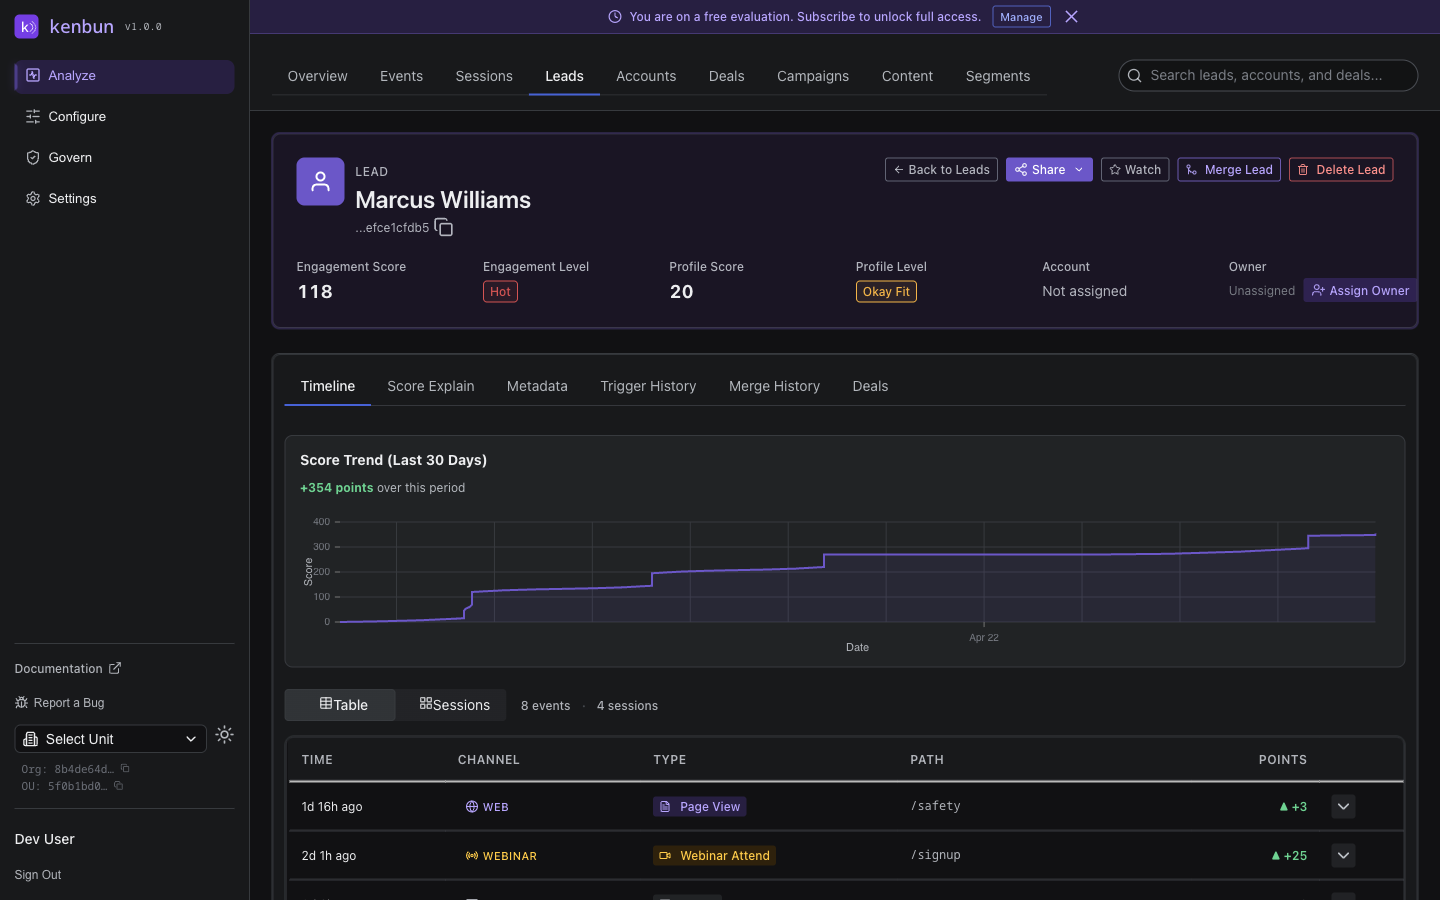
- Look for the Score History chart near the top
- The chart shows the last 30 days by default
Chart Features:
- Sparkline Visualization: Compact line chart showing score trend
- Hover Details: Hover over the chart to see exact scores and dates
- Color Coding: Rising scores shown in green, declining in red
- Trend Indicator: Arrow showing overall direction (↑ or ↓)
- Conversion Milestone Dots: Key engagement events appear as dots along the chart line. When a dot represents a conversion event (such as a closed-won deal or a lifecycle stage change to Customer), it renders in green so you can instantly spot the moment a lead converted.
Score History Chart
The score history chart provides a quick visual summary:
Chart Elements:
- X-Axis: Time (last 7, 30, or 90 days)
- Y-Axis: Lead score
- Line Graph: Shows score changes over time
- Data Points: Hover to see exact score and timestamp
- Trend Line: Shows overall trajectory
Example Visualization:
Score
100 ┤     ╭─╮
 75 ┤   ╭─╯ ╰─╮
 50 ┤ ╭─╯     ╰─╮
 25 ┤─╯         ╰─
 0  └─────────────> Time
    7d ago    Now
Interpreting Score History
Common Patterns
Steady Growth (Positive Trend):
- Lead shows consistent engagement
- Good candidate for sales outreach
- May be researching solutions actively
Sharp Spike:
- Sudden increase in activity
- May indicate buying intent or campaign response
- Good time to reach out
Plateau:
- Score remains stable
- Lead is engaged but not taking new actions
- Consider new content or nurture campaign
Decline:
- Score decreasing over time
- May indicate lost interest or decay rules kicking in
- Re-engagement campaign might help
Inactive (Flat):
- No score changes
- Lead hasn't engaged recently
- May need re-activation
Using Score Trends for Outreach
Best Times to Reach Out:
- After a Spike: Lead just showed increased interest
- During Growth: Lead is becoming more engaged
- Before Decline: Catch them while still interested
- After Plateau: Break the pattern with something new
When to Hold Off:
- Steep Decline: Focus on more engaged leads first
- Flat at Zero: Lead hasn't engaged in a long time
- Just After Outreach: Give them time to respond
Score at Conversion
When a lead has a conversion event in their history — such as reaching the Customer lifecycle stage or a deal closing as Closed Won — a "Converted at X pts" badge appears next to the "Score Trend (Last 30 Days)" chart title on the lead detail page.
This badge shows the lead's score at the exact moment they converted, along with the conversion date. You can see this information at a glance without hovering over the chart, making it easy to answer questions like "what score did this lead reach before they bought?"
Conversion events kenbun recognises for this badge include: customer, lifecycle:customer, closedwon, and deal_stage:closedwon.
Filtering Score History
You can filter score history to focus on specific time periods:
Time Range Options:
- Last 7 Days: See recent activity patterns
- Last 30 Days: Standard view for most leads
- Last 90 Days: Full retention period, see long-term trends
- Custom Range (if available): Pick specific start and end dates
Filtering by Ruleset:
If you use multiple scoring rulesets, you can filter to see scores from a specific ruleset:
- View engagement score history only
- View profile score history only
- View account score history (if ABM enabled)
API Access
You can retrieve score history programmatically:
Get Lead Score History
GET /lead/{leadID}/score-history
Retrieve score history for a specific lead.
curl -X GET "https://api.kenbun.io/lead/ld_123/score-history?days=30" \
  -H "Authorization: Bearer <token>"
Query Parameters:
| Parameter | Type | Required | Description |
|---|---|---|---|
days | integer | No | Number of days to retrieve (default: 30, max: 90) |
ruleset_id | string | No | Filter to specific ruleset |
start_date | string | No | Start date (ISO 8601 format) |
end_date | string | No | End date (ISO 8601 format) |
Response:
{
  "lead_id": "ld_123",
  "snapshots": [
    {
      "snapshot_at": "2025-01-15T10:00:00Z",
      "score": 45,
      "ruleset_id": "ruleset_default"
    },
    {
      "snapshot_at": "2025-01-15T11:00:00Z",
      "score": 50,
      "ruleset_id": "ruleset_default"
    },
    {
      "snapshot_at": "2025-01-15T12:00:00Z",
      "score": 50,
      "ruleset_id": "ruleset_default"
    }
  ],
  "count": 3,
  "period": {
    "start": "2025-01-15T00:00:00Z",
    "end": "2025-01-16T00:00:00Z"
  }
}
Technical Details
Score Snapshot Timing
Score snapshots are captured automatically every hour. During periods of high activity, snapshots may be taken slightly later but will always catch up.
Retention Policy:
- Default: 90 days
- Configurable per organization
- Older snapshots automatically deleted
Data Privacy
Score history respects organizational boundaries:
- All data is OU-scoped
- Users only see leads in their authorized OUs
- Snapshots are deleted when leads are deleted
- Complies with data retention policies
Use Cases
Sales Timing
Scenario: You want to know the best time to reach out to a lead.
How Score History Helps:
- View lead's score history chart
- Identify upward trends or recent spikes
- Reach out during periods of increased engagement
- Avoid contacting during declining engagement
Campaign Effectiveness
Scenario: You ran an email campaign and want to measure impact.
How Score History Helps:
- Note the campaign send date
- Compare scores before and after campaign
- Identify leads who showed score increases
- Segment responders for follow-up
Lead Qualification
Scenario: You need to prioritize which leads to call first.
How Score History Helps:
- Sort leads by recent score changes
- Focus on leads with upward trends
- Deprioritize leads with declining scores
- Watch for sudden spikes indicating buying intent
Engagement Health Monitoring
Scenario: You manage a portfolio of accounts and want to spot problems early.
How Score History Helps:
- Review score trends for key accounts weekly
- Identify accounts showing declining engagement
- Trigger re-engagement campaigns proactively
- Track recovery after intervention
Best Practices
Monitoring Score Trends
- Check Weekly: Review score history for your top leads weekly
- Set Alerts: Use milestone triggers to notify you of big changes
- Compare Patterns: Look for similarities among high-converting leads
- Track Campaigns: Monitor score impacts after major campaigns
Interpreting Data
- Context Matters: Consider what events occurred during score changes
- Look for Patterns: Single data points are less meaningful than trends
- Account for Decay: Remember that inactivity can reduce scores
- Multiple Rulesets: If using multiple rulesets, view each separately
Taking Action
- Respond to Spikes: Have a process for reaching out when scores jump
- Address Declines: Create re-engagement workflows for declining leads
- Celebrate Success: Share examples of score trends that led to wins
- Refine Scoring: Use history to validate your scoring rule effectiveness
Troubleshooting
No Score History Showing
- New Lead: Score history starts when the lead is created or when snapshots began
- No Activity: Leads with zero activity will have flat score lines
- System Timing: Wait 1-2 hours after lead creation for first snapshot
- OU Scope: Ensure you're viewing the correct Organizational Unit
Chart Not Loading
- Check your internet connection
- Refresh the page
- Ensure you have permission to view the lead
- Contact support if issue persists
Unexpected Score Changes
- Review the lead's activity timeline to see what events occurred
- Check if decay rules are reducing scores automatically
- Verify scoring rules are configured as expected
- Look at score explanation to see which rules fired — the explain panel now shows the specific rule name that matched each event, along with any attribute filter conditions that were applied
Missing Historical Data
- Score snapshots may have started after the lead was created
- Historical data is retained for 90 days (default)
- Very old snapshots may have been automatically deleted
- Data before snapshot feature launch won't be available
Related Features
- Watch List: Track specific leads and monitor score changes over time
- Score Explanation: See detailed breakdown of how a score was calculated
- Milestone Triggers: Automate actions when scores cross thresholds
- Lead Activity Timeline: View all engagement events for context
- Decay Rules: Understand how inactivity affects scores over time