Audit Logs
Audit Logs give your team a complete record of every action taken in kenbun — who did what, and when. Use them to investigate unexpected changes, support compliance reviews, or simply understand how your team is using the platform.
Understanding Audit Logs
Every time a user creates, updates, deletes, or views something in kenbun, an entry is recorded. You can browse these entries in two ways:
- Business Events — A plain-language feed that translates raw actions into readable sentences, such as "jane.doe created scoring rule 'High Intent'." This view is ideal for day-to-day review.
- Raw API Log — The full technical log, showing HTTP method, path, status code, IP address, and response time. This view is useful for troubleshooting or security investigations.
Accessing Audit Logs
Navigate to Govern > Audit Logs in the main navigation.
The page opens on the Business Events tab. By default, all activity is shown — including page views, data lookups, and changes.
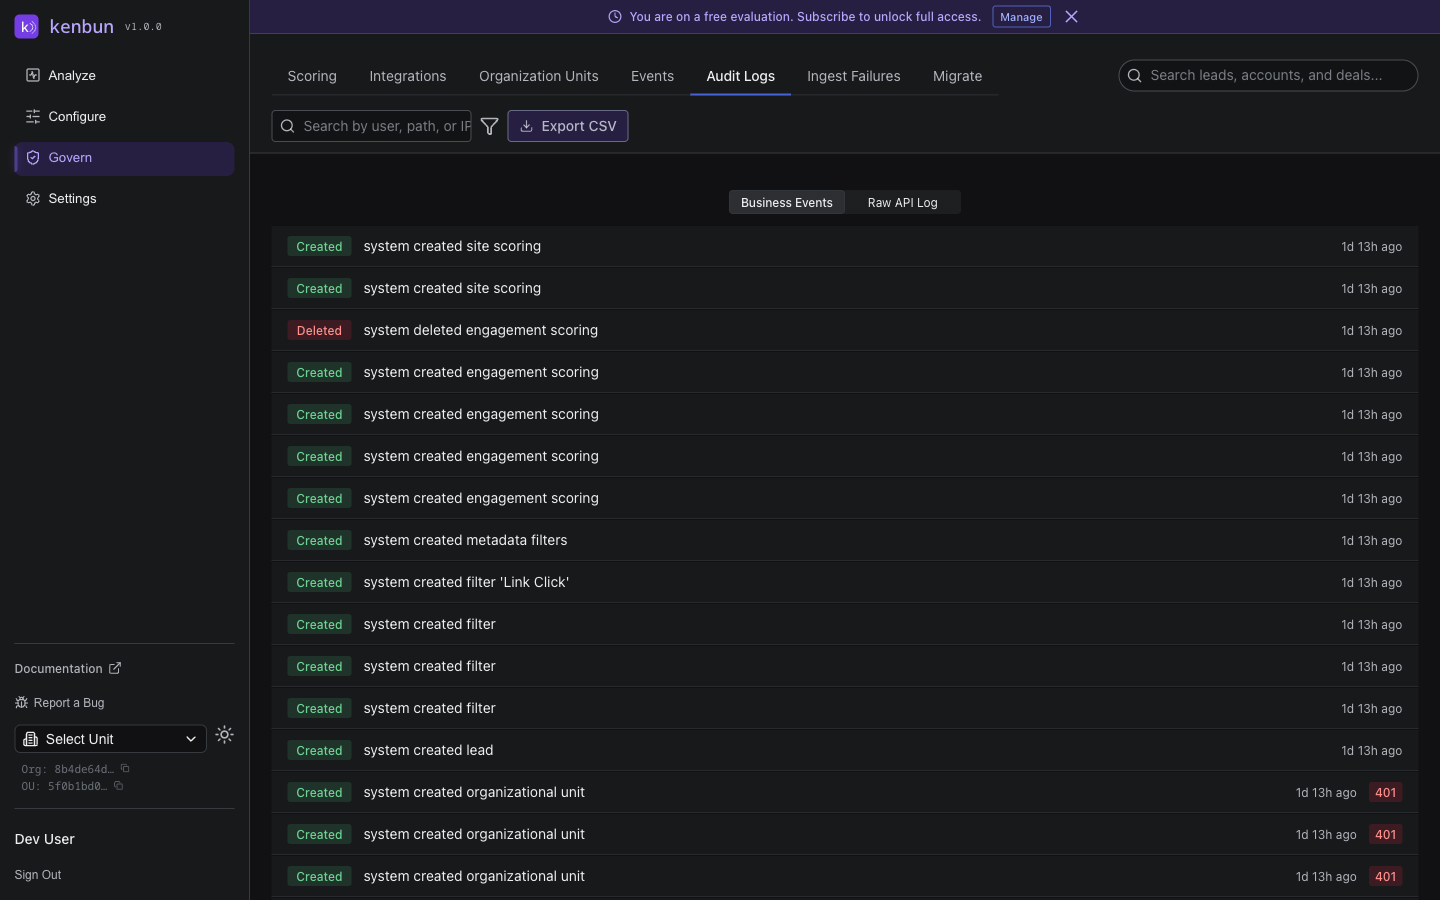
Navigating the Business Events Tab
The Business Events tab provides a chronological feed of actions taken by your team. Each entry shows:
| Column | Description |
|---|---|
| Verb badge | The type of action: Created, Updated, Deleted, Viewed, Merged, or Exported |
| Description | A plain-language sentence describing what happened and who did it |
| Time | How long ago the action occurred (hover for the exact timestamp) |
| Error indicator | If the action failed, a red status badge is shown |
Hiding Read-Only Activity
By default, the Business Events tab shows all activity, including page views and data lookups. If you want to focus only on changes (creates, updates, and deletes), use the Hide Read-Only toggle in the top-right of the log.
When Hide Read-Only is on, view-only actions are filtered out, leaving only actions that modified data.
Navigating the Raw API Log
The Raw API Log tab shows the underlying technical details of each request. Switch to it using the Raw API Log option in the segmented control above the table.
| Column | Description |
|---|---|
| Time | Date and time of the action |
| User | Email address of the user who performed the action |
| Method | HTTP method: GET, POST, PUT, PATCH, DELETE, or MERGE |
| Path | The area of the platform that was accessed |
| Status | Result code — green for success, orange for client errors, red for server errors |
| IP | Network address of the user (approximate) |
| Latency | How long the action took to complete |
Click the expand icon on any row with additional details to view structured information about that action, such as which leads were involved in a merge.
Sortable Columns
Click any column header to sort by that column. Click again to reverse the sort order.
Filtering Audit Logs
Use the search bar and filter controls to narrow down the log.
Search — Enter a user email, path, or IP address to find matching entries.
Advanced Filters — Click the filter icon to expand additional options:
| Filter | Description |
|---|---|
| Method | Filter by action type: GET, POST, PUT, PATCH, DELETE, or MERGE |
| Status | Filter by outcome: 2xx (success), 4xx (client error), or 5xx (server error) |
| From Date | Show only entries on or after this date |
| To Date | Show only entries on or before this date |
Active filters appear as dismissible badges below the search bar. Click a badge to remove that filter, or click Clear all to reset everything.
Exporting Audit Logs
Click Export CSV to download the current filtered view as a CSV file. The export includes all visible entries and respects any active filters and sort order.
Pagination
Audit Logs are displayed in pages of 25, 50, or 100 entries. Use the pagination controls at the bottom of the page to move between pages or change the page size.
Best Practices
Review regularly. Check the Business Events feed after any significant configuration change — such as updating scoring rules or modifying triggers — to confirm the change was applied correctly.
Filter to changes only. For routine monitoring, enable Hide Read-Only to focus on actions that modified data rather than wading through view activity.
Use date filters for investigations. When investigating an unexpected change, set a date range that covers when the change likely occurred, then filter by method (PUT, POST, DELETE) to narrow the results quickly.
Export for compliance. If your organization requires periodic audit exports, download filtered CSV exports covering the relevant time window and store them according to your retention policy.
Troubleshooting
The Business Events tab appears empty
Check whether Hide Read-Only is enabled. If it is, only change actions (creates, updates, deletes) are shown. If your team has only been viewing pages without making changes, the feed will be empty. Disable Hide Read-Only to see all activity.
An expected action does not appear
Audit Logs record all API actions performed through the kenbun UI and API. Actions taken directly in an integrated system (such as a CRM) are not recorded here unless they triggered a kenbun API call.
I see a red status badge on an entry
A red badge indicates the action returned an error. Expand the row (in Raw API Log view) to see any additional details. Common causes include insufficient permissions (403) or attempting to act on a resource that no longer exists (404).